
Interactive Dashboards for Early Childhood Intervention Workforce Analysis
Visualizing workforce stress, compensation, and supervision patterns
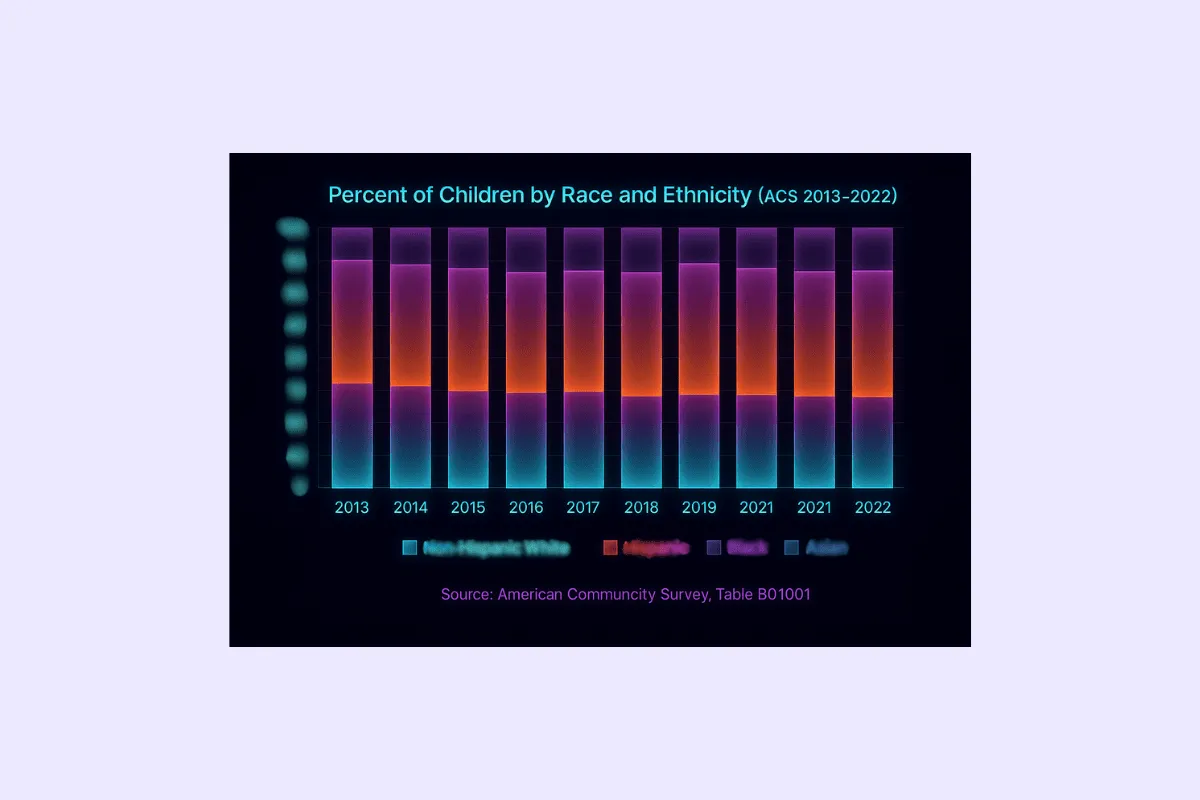
As part of Texas’s Preschool Development Grant (PDG B-5), I contributed to the statewide Early Childhood System Needs Assessment, which analyzed how Texas supports its youngest children. Using Stata, I cleaned and analyzed large-scale demographic, economic, and program data to identify patterns in population growth, access to early learning programs, and child well-being.
Early Childhood System in Texas
Dashboard Design & Statistical Findings
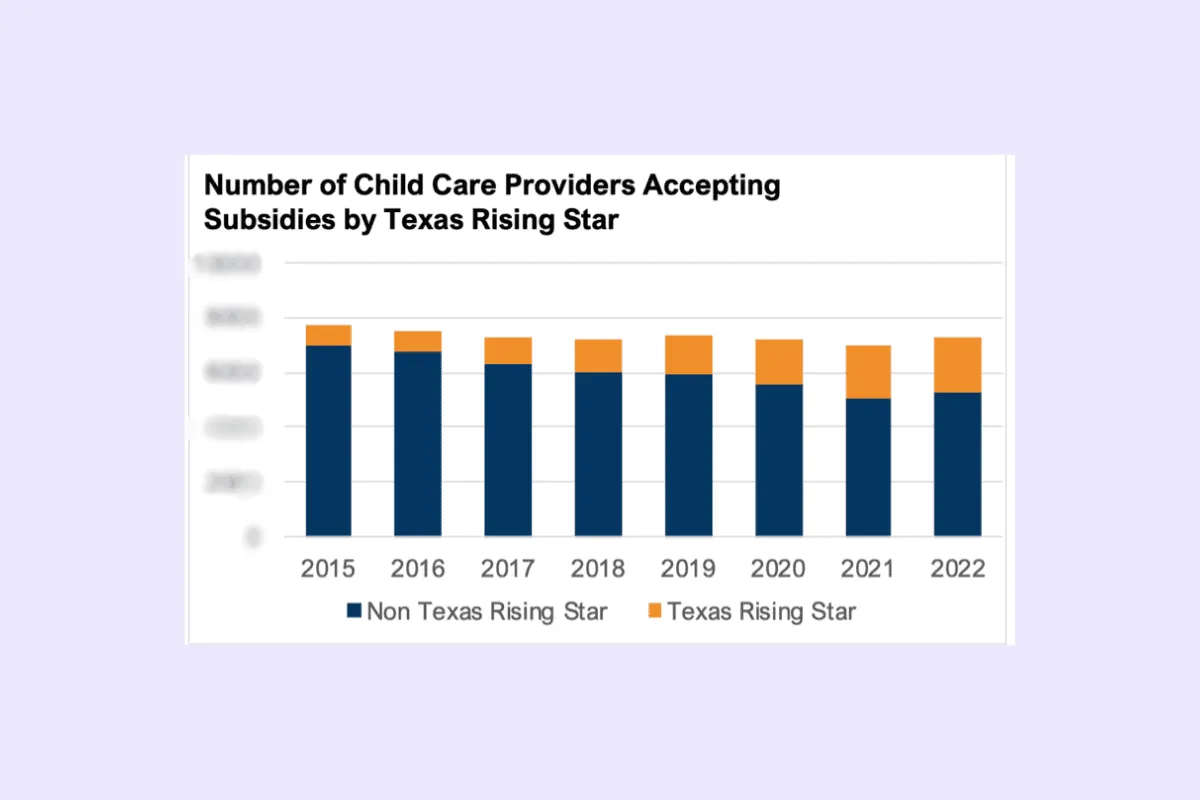
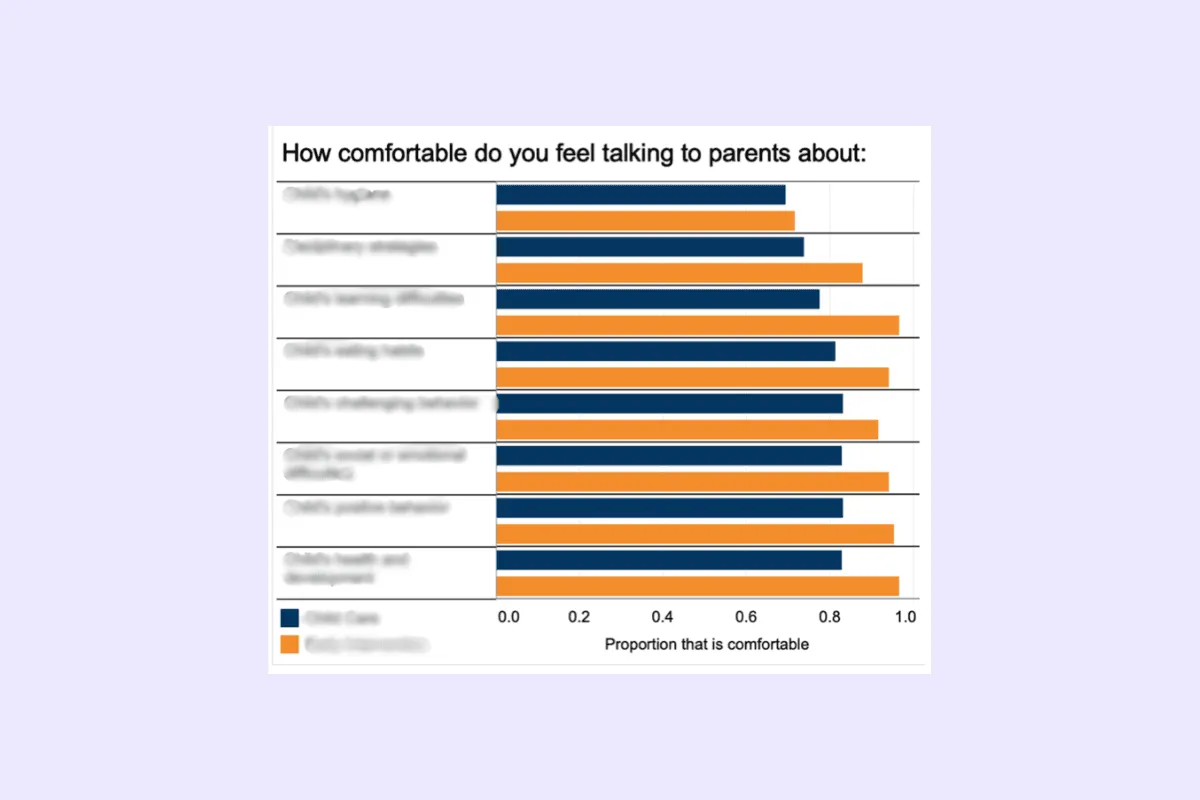
I created Excel-based visualizations that were integrated into the published PDG-B5 report, providing policymakers with clear visuals on population shifts, poverty trends, and workforce gaps. These insights directly informed the Texas Early Learning Strategic Plan, guiding resource allocation and program planning across the state.
To complement the report, I also built interactive Tableau dashboards for the Early Childhood Intervention (ECI) component, allowing stakeholders to explore workforce challenges by region and program type. Behind the visualizations, I conducted regression modeling to test relationships.
This project demonstrated how quantitative analysis, accessible visualization, and policy collaboration can transform raw data into meaningful strategies for early childhood system improvement in Texas.